Whether you're gaming on a smartphone, tablet, notebook, laptop, desktop, or a high performance gaming PC, 3DMark includes a benchmark designed specifically for your type of device. And it's not just for Windows. With 3DMark you can compare your scores with Android and iOS devices, too. It's the most powerful and flexible 3DMark we've ever created.
Can I use 3DMark Basic Edition to benchmark my CPU and GPU?
Yes, although 3DMark Basic is primarily a GPU benchmark, it will also leverage your CPU. The benchmark application will show detailed charts of CPU and GPU temperatures, clock speeds, and frame rate changes during your benchmark run. A more complete (paid) version of 3DMark can test your CPU more thoroughly along with other tests like ray tracing and even storage.
Which 3DMark benchmark should I use?
3DMark Basic Edition includes three benchmarks: Time Spy, Night Raid and Fire Strike, each test is designed for a specific type of hardware/feature. When you open the app, 3DMark automatically scans your hardware and recommends the best benchmark for your system but you can run any of the tests without worries.
How long does it take to run a 3DMark benchmark?
Usually, 3DMark Basic Edition takes 10 minutes to benchmark your system.
Can the benchmark damage my CPU?
No, 3DMark only measures your device's performance. It produces a score to compare with other PC systems. If your temps and voltages are safe, it will not hurt your computer. You can also change the resolution and other quality settings to make the benchmarks more or less demanding.
Is 3DMark Basic Edition free?
Yes, 3DMark Basic is free for home users, but there are other paid versions that include many more benchmarks and tests.
Features
- The world's most popular benchmark.
- Includes three stunning tests for DirectX 9, DirectX 10 and DirectX 11 hardware.
- Test everything from tablets to gaming PCs.
- Includes Ice Storm, Cloud Gate and Fire Strike.
- Compare scores across Windows, Android and iOS.
- Easy to use, no technical know-how needed.
- Free online account to manage your results.
What's New
3DMark Windows 2.29.8282
Fixed
- Fixed an issue where language selector did not function correctly.
- Fixed an issue where the Speed Way Stress Test was missing from the stress test page.
3DMark Windows 2.29.8278
New
- Solar Bay is now available for Windows on Arm devices that support Vulkan and ray tracing. (Requires graphics drivers supporting Vulkan to be installed)
- Wild Life is now available for Windows on Arm devices.
- Added the ability for Windows on Arm devices to choose between the Vulkan and DirectX 12 APIs for Wild Life Extreme custom runs. (Requires graphics drivers supporting Vulkan to be installed)
Fixed
- The audio toggle for Steel Nomad and Steel Nomad Light is now more obvious.
- Fixed an issue where Night Raid would incorrectly run full screen when set to run in windowed mode.
- Fixed an issue where Wild Life would crash on Windows on Arm devices.
Previous releases notes
3DMark Steel Nomad is out now
Today, we're thrilled to launch 3DMark Steel Nomad and 3DMark Steel Nomad Light. This update includes two new non-raytraced cross-platform benchmarks – Free for all 3DMark users.
Time to Move on
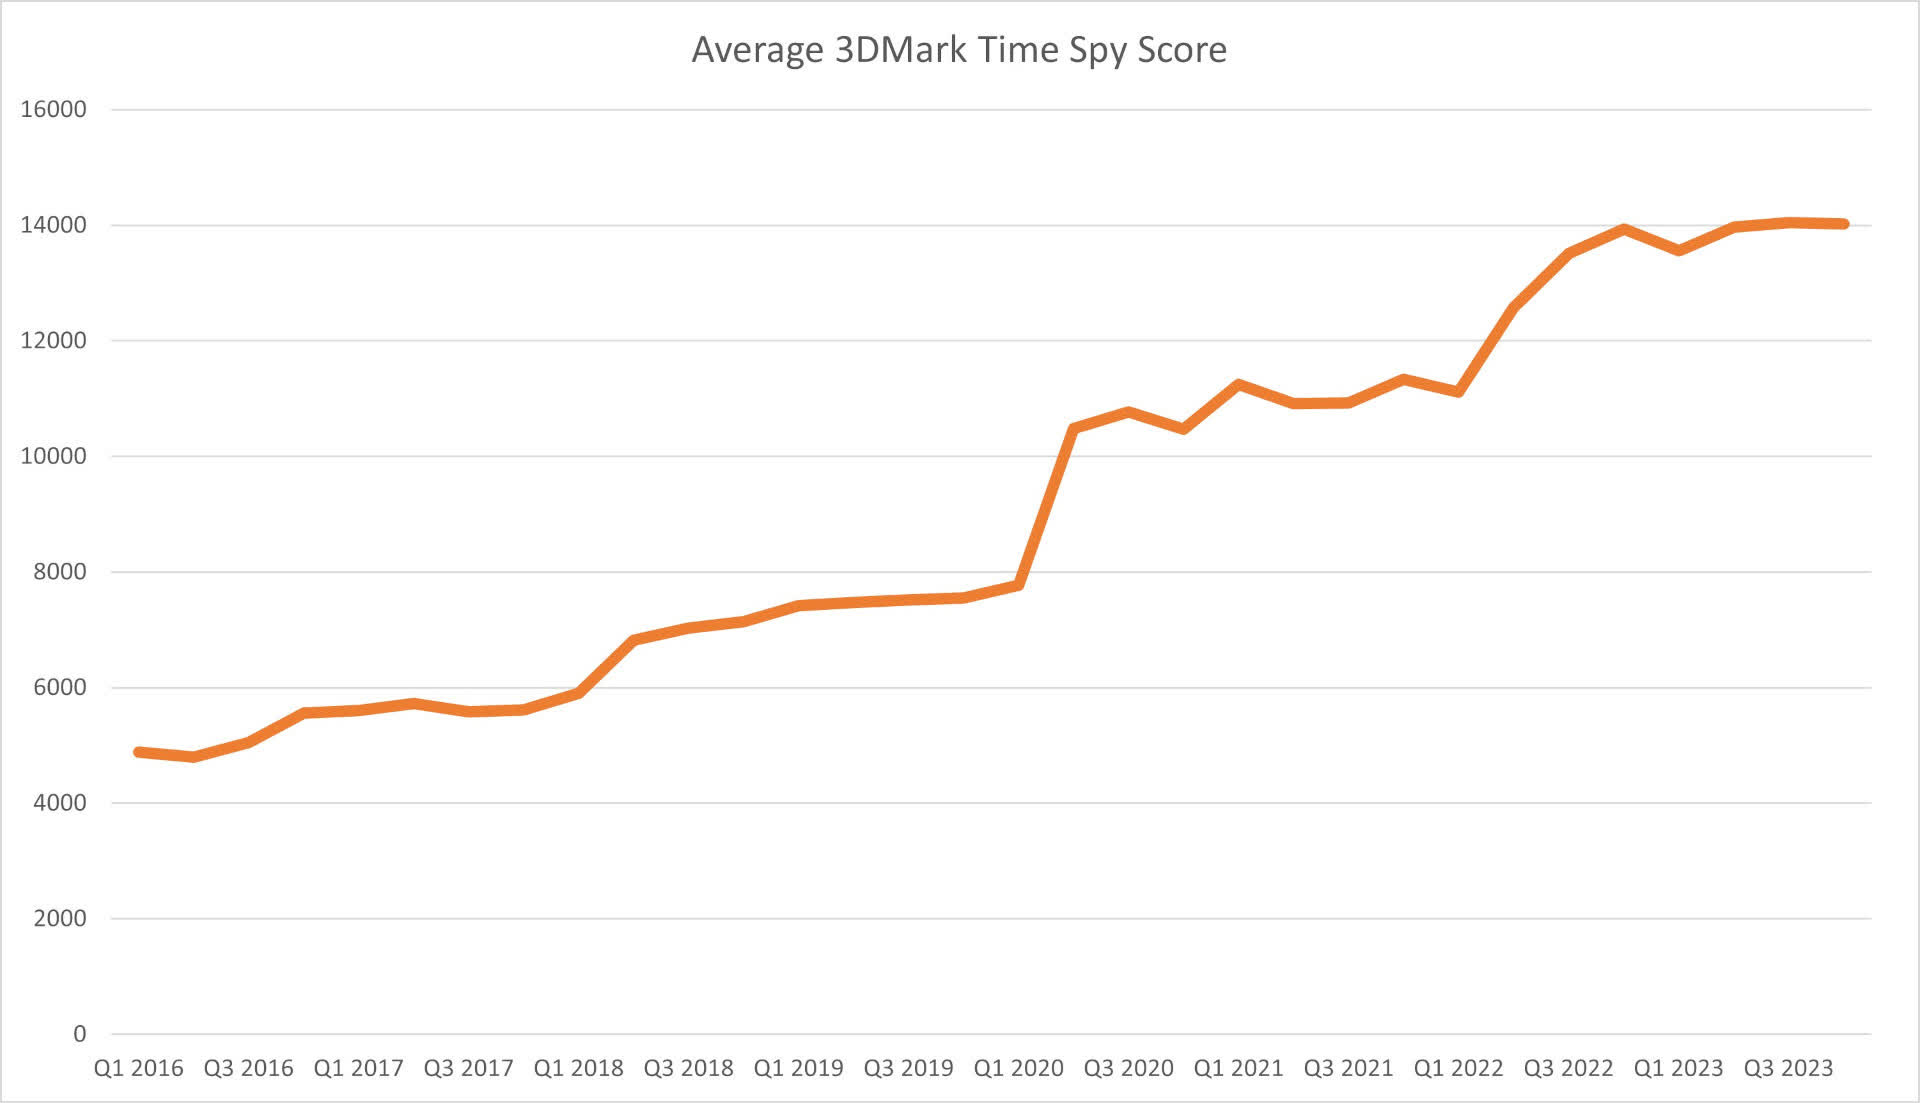
Since Time Spy launched in 2016, there's been a truly gigantic number of submitted results: Almost 48 million.
Over time, the average Time Spy score has approximately quadrupled. This, alongside game and hardware technology developments over the last eight years, meant that Time Spy was starting to show its age, and a new non-ray-traced benchmark was needed.
We're not fully retiring Time Spy just yet, but we suggest you use our latest benchmarks to get the best benchmarking experience on modern hardware.
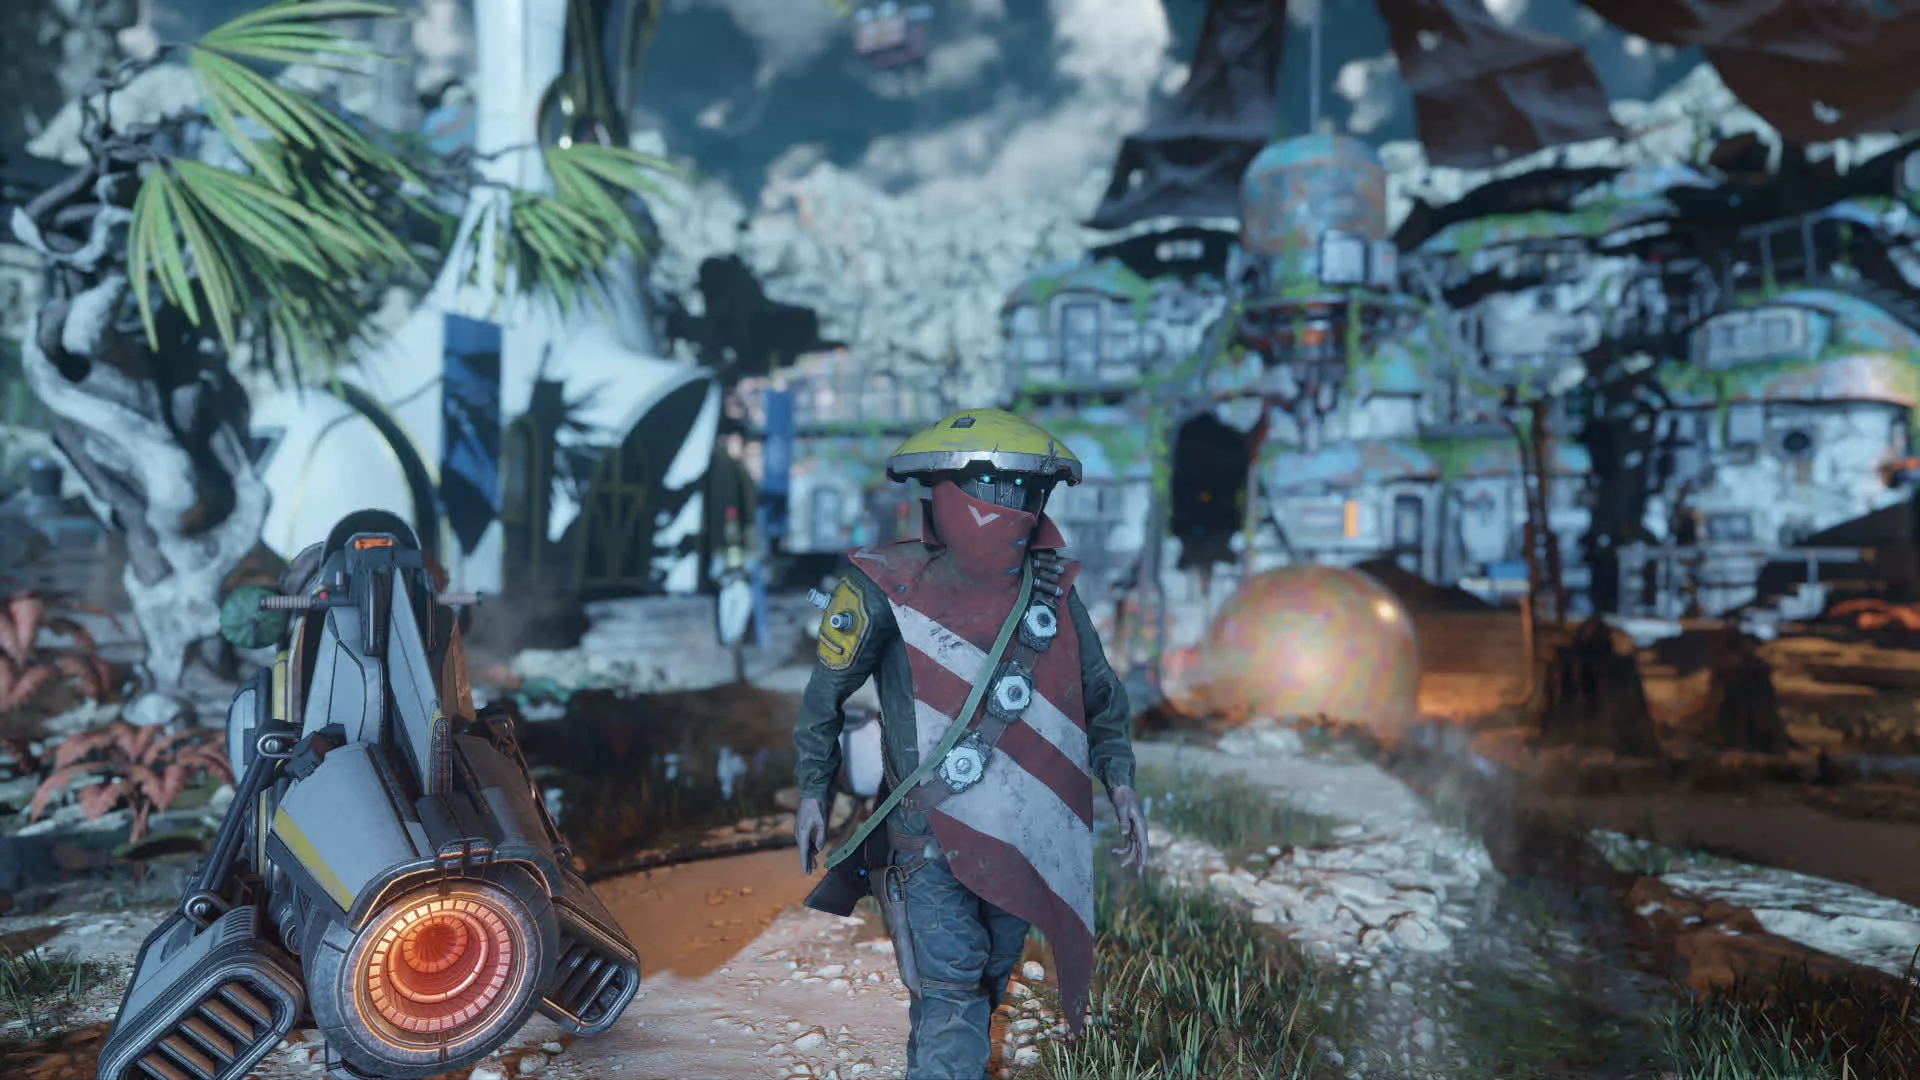
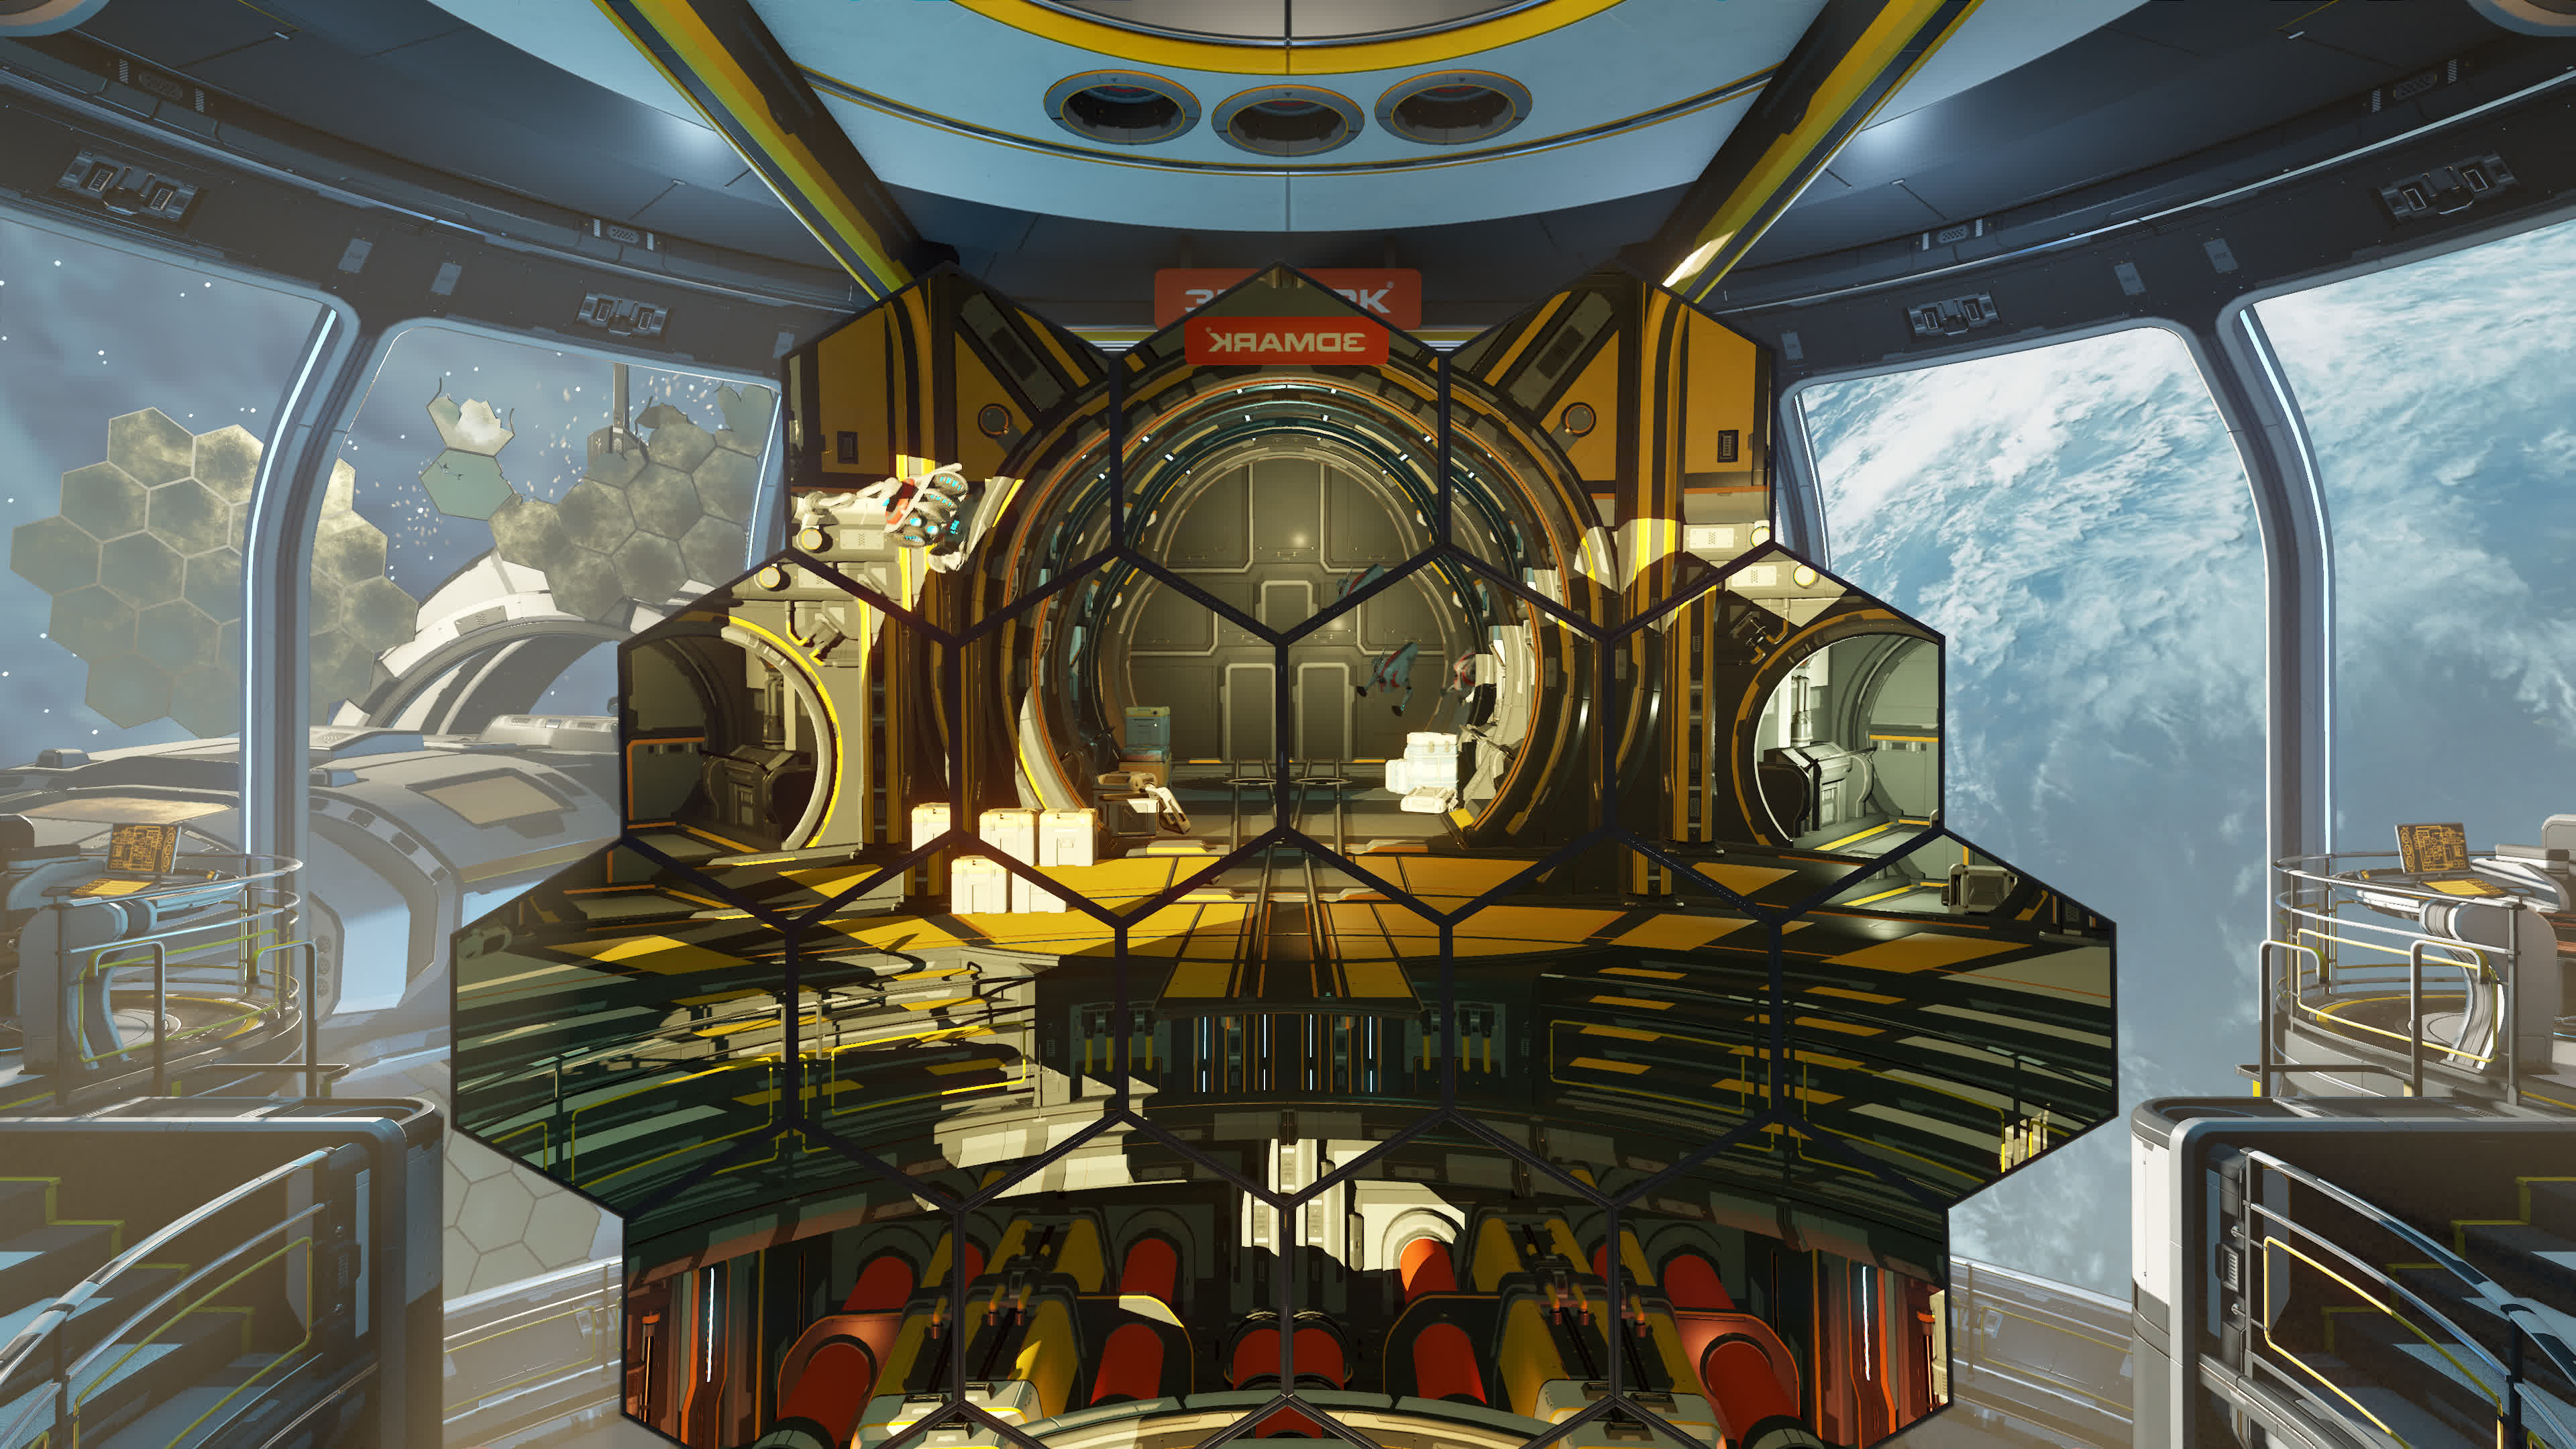
Steel Nomad strides into town
Steel Nomad is a non-raytraced, cross-platform GPU benchmark that uses graphics technologies just like your favorite new game titles.
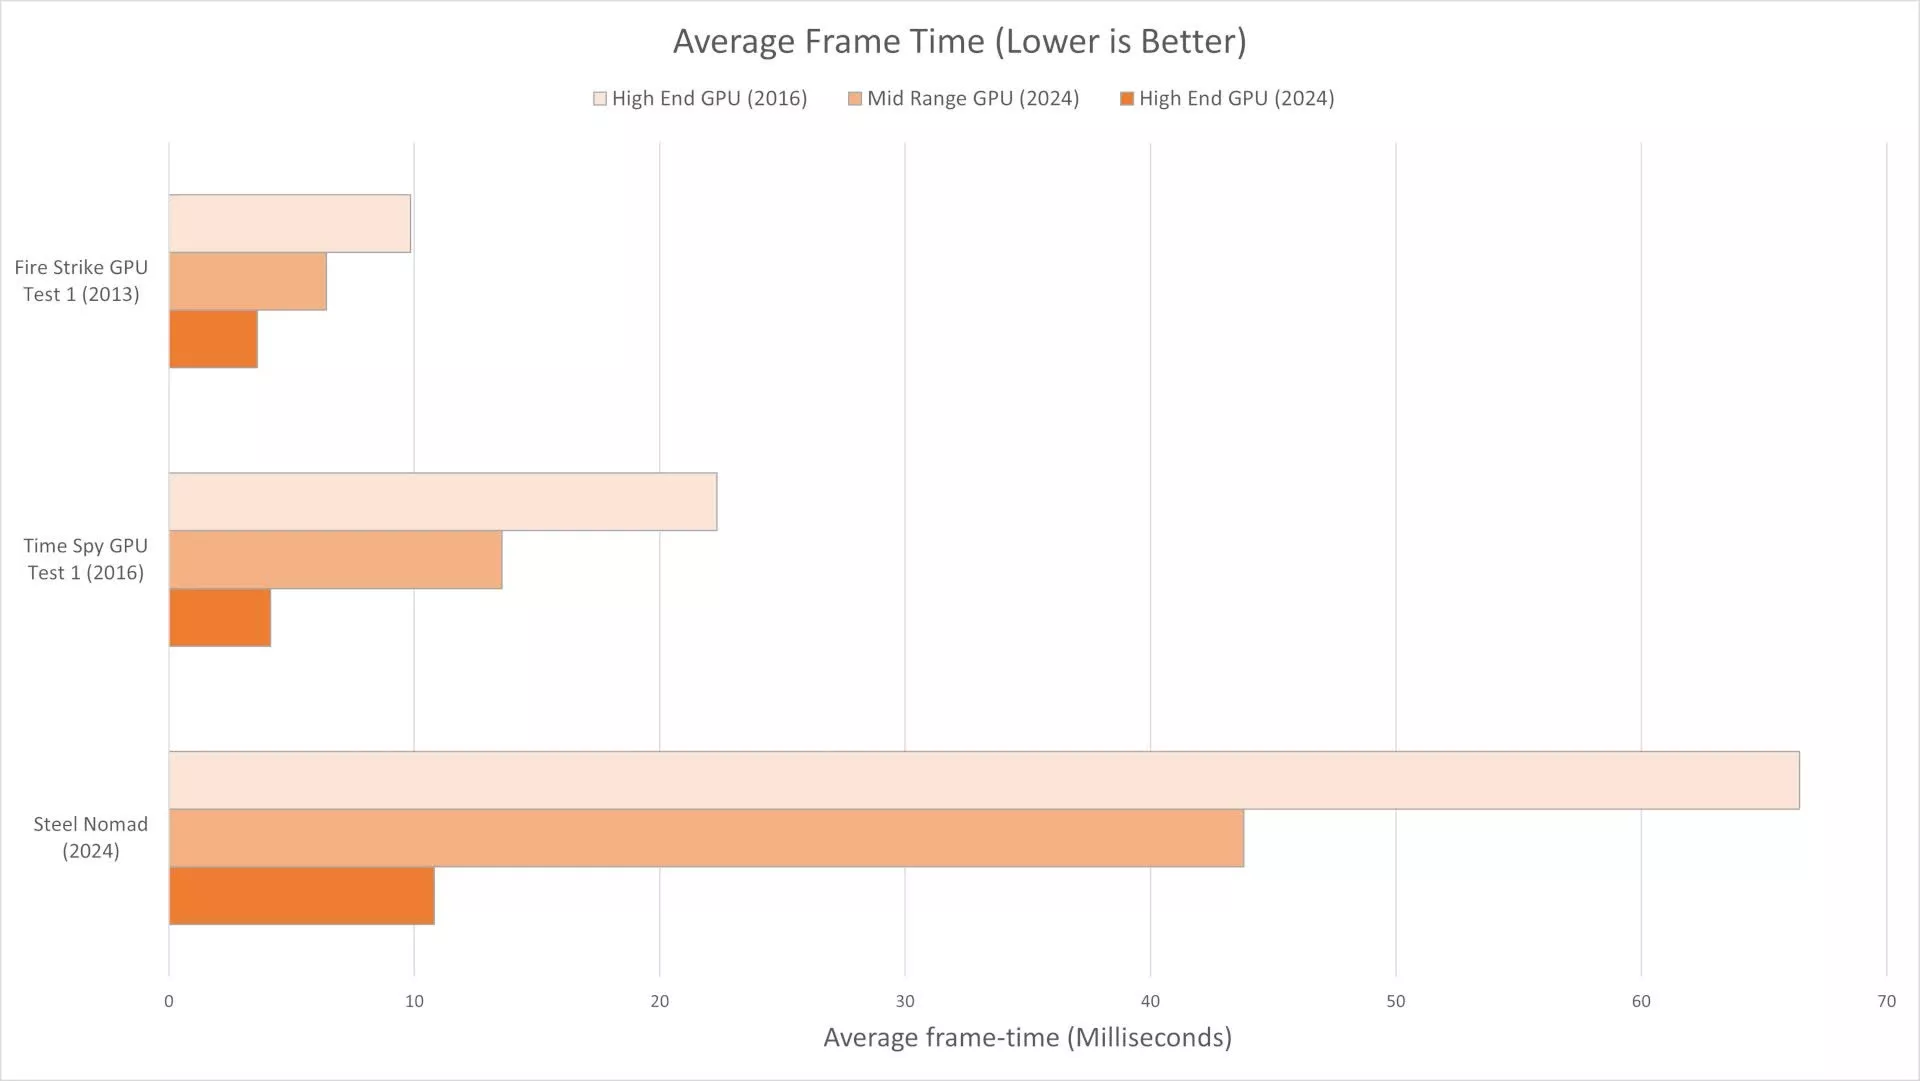
Running at a native 4k resolution, it improves upon Time Spy with more modern implementations of graphics technologies and is roughly three times heavier for your PC than Time Spy, and almost seven times heavier than Fire Strike. You can see this is not reflected in the data from a high-end GPU from 2024, as CPU bottlenecking is negatively impacting frame times in Fire Strike and Time Spy.
Steel Nomad launches today on Windows and Windows-on-Arm using the DirectX 12 and Vulkan APIs, Android using Vulkan, and iOS using Metal. As a cross-platform benchmark, we'll be releasing support for new APIs and platforms throughout the year. Also, due to popular demand, we've brought back sound for this benchmark.
Stay tuned for information on macOS soon! As for Linux gamers, unfortunately you'll have to wait a bit longer, but we are still committed to releasing 3DMark Steel Nomad for you as well.
"This town is big enough for the both of us"
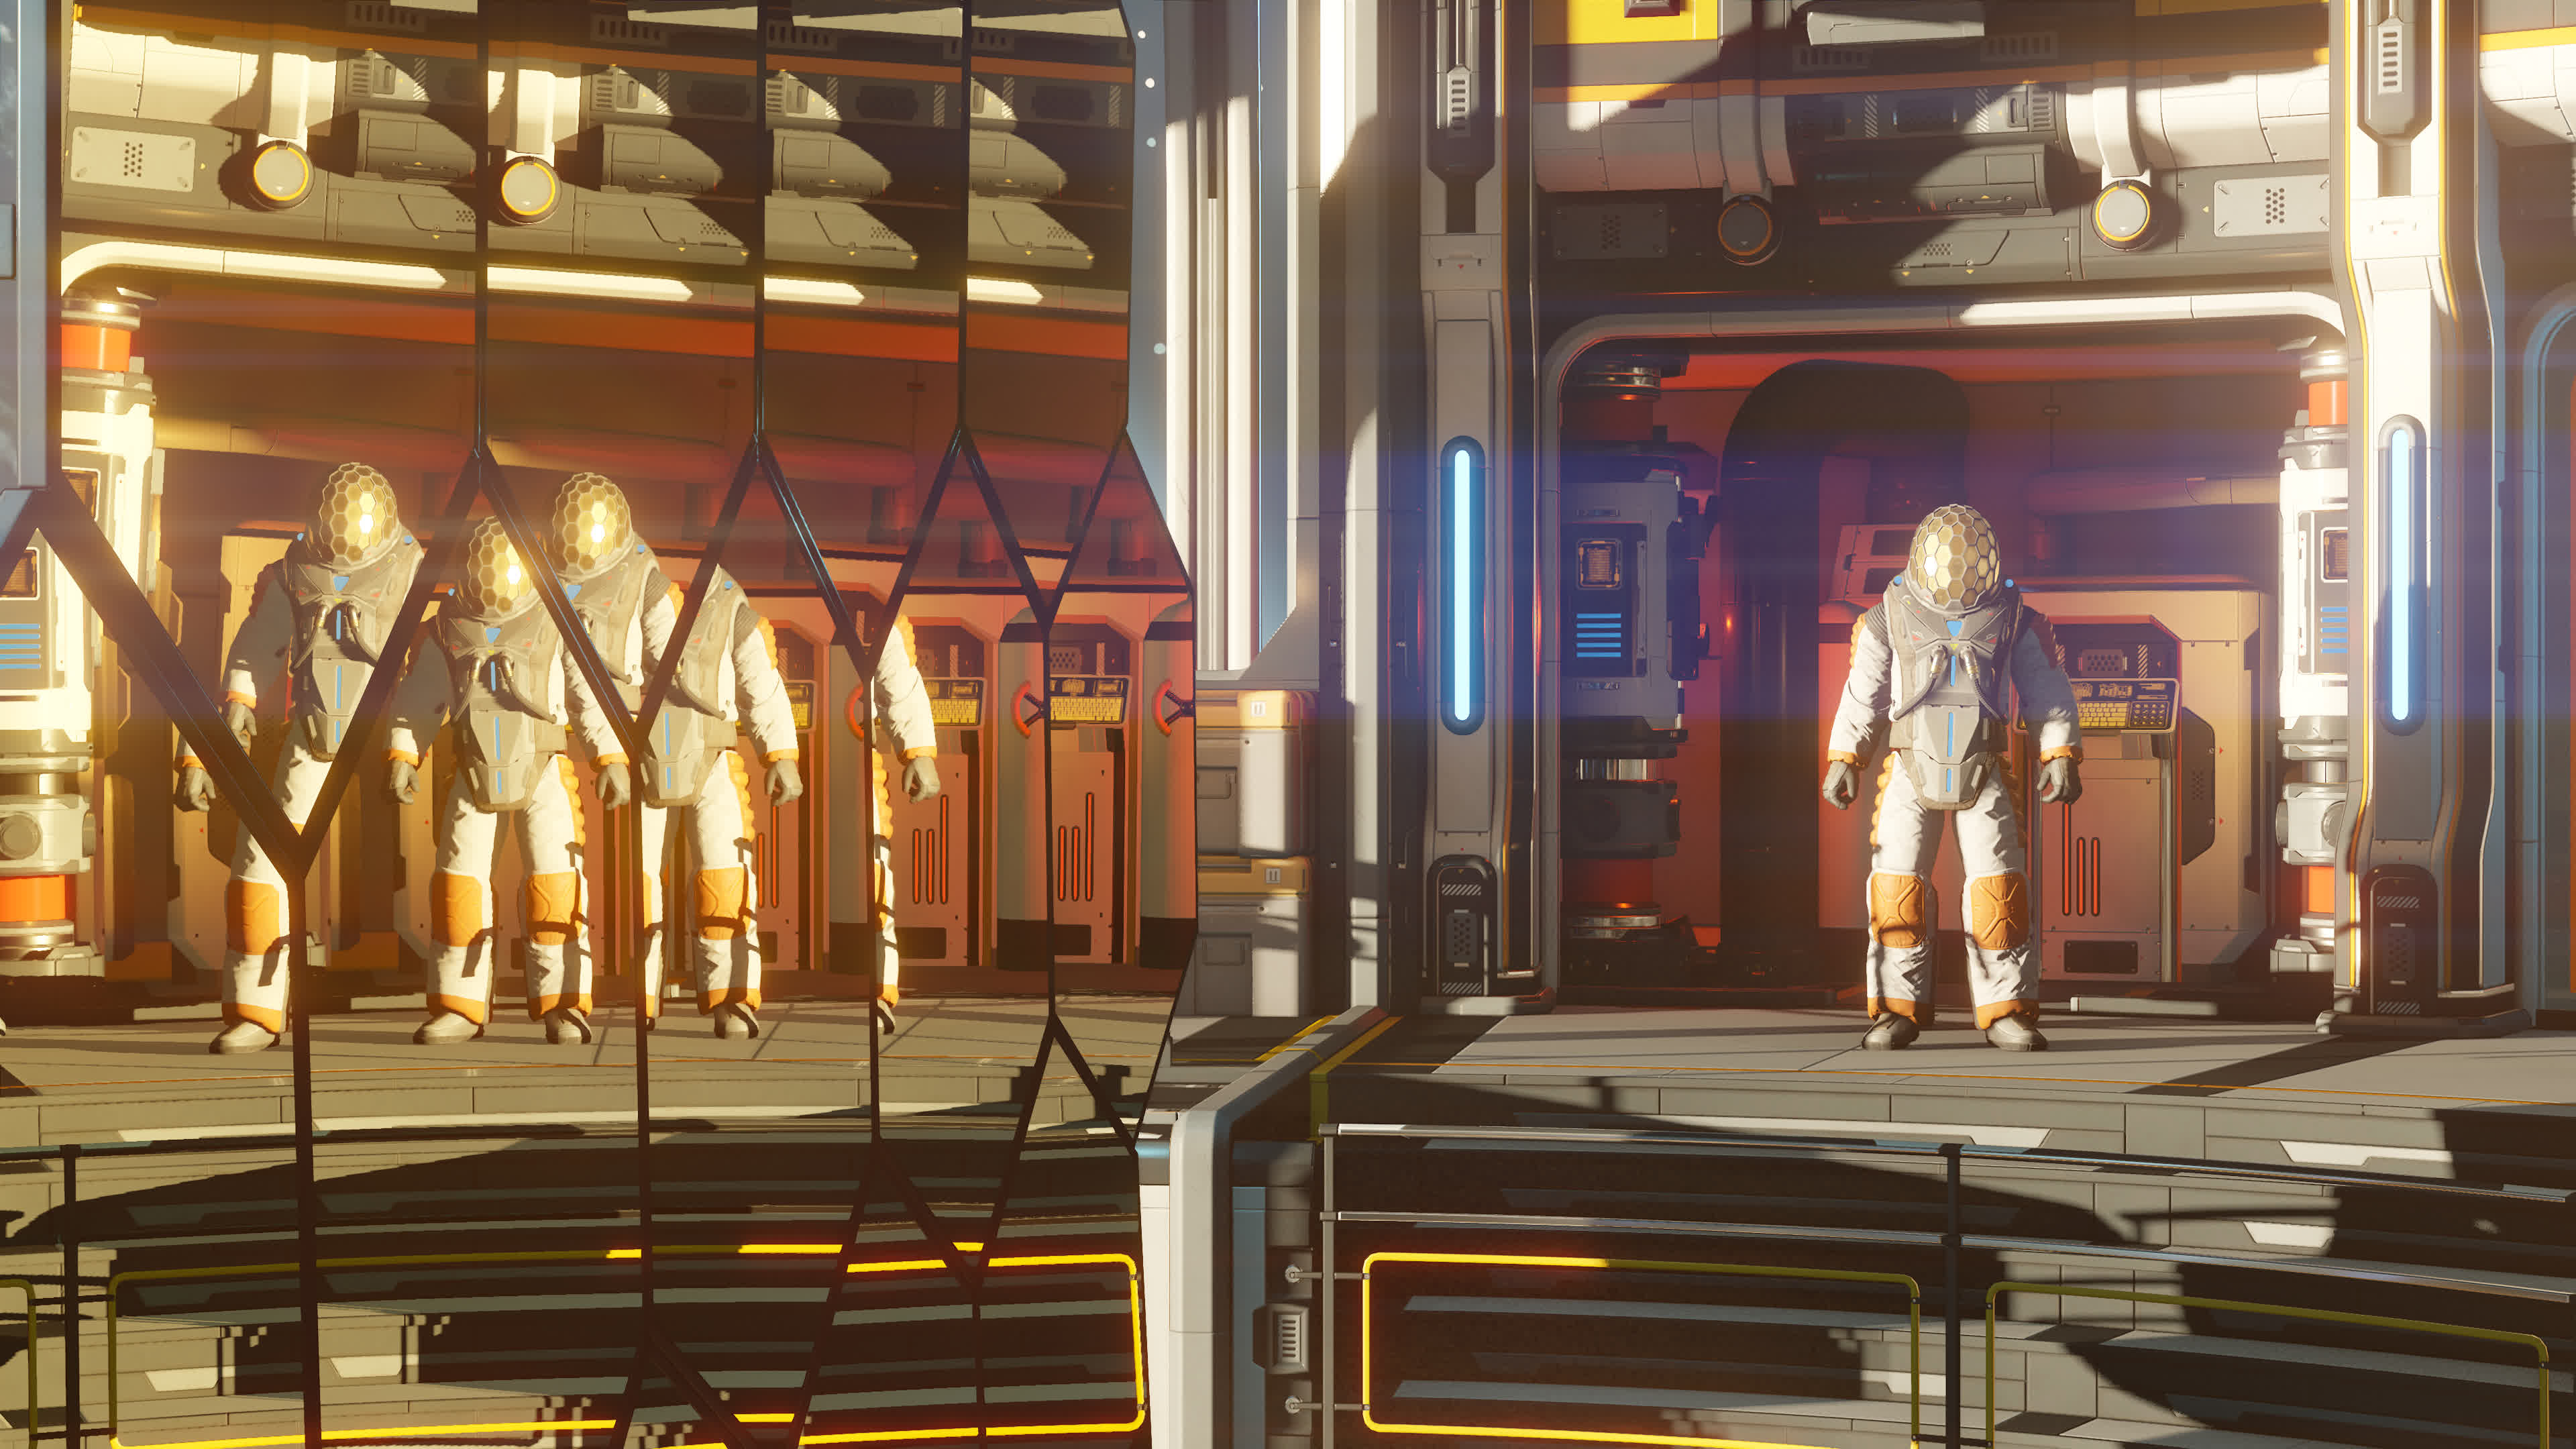
PC gaming is more accessible, portable and flexible than ever. Desktop rigs are pushing more frames than ever, laptops are capable of comfortably playing top-end games, phones and tablets have the power to deliver full gaming experiences, and we've seen the rise of portable handheld gaming PCs in recent years.
With so many hardware configurations, Steel Nomad arrives alongside Steel Nomad Light, letting gamers, reviewers, and enterprises test all their gaming hardware in a non-ray-traced gaming workload.
With the addition of these two benchmarks, the 3DMark application provides a complete set of benchmarks for testing modern gaming hardware in both raytraced and non-raytraced gaming situations.
| Very Heavy | Heavy | Medium | Light | |
|---|---|---|---|---|
| Ray-tracing | Speed Way (Windows only) | Port Royal (Windows only) | Solar Bay (cross-platform) | |
| Non-ray-tracing | Steel Nomad (cross-platform) | Steel Nomad Light (cross-platform) | Wild Life Extreme (cross-platform) |
Explore the Frontier
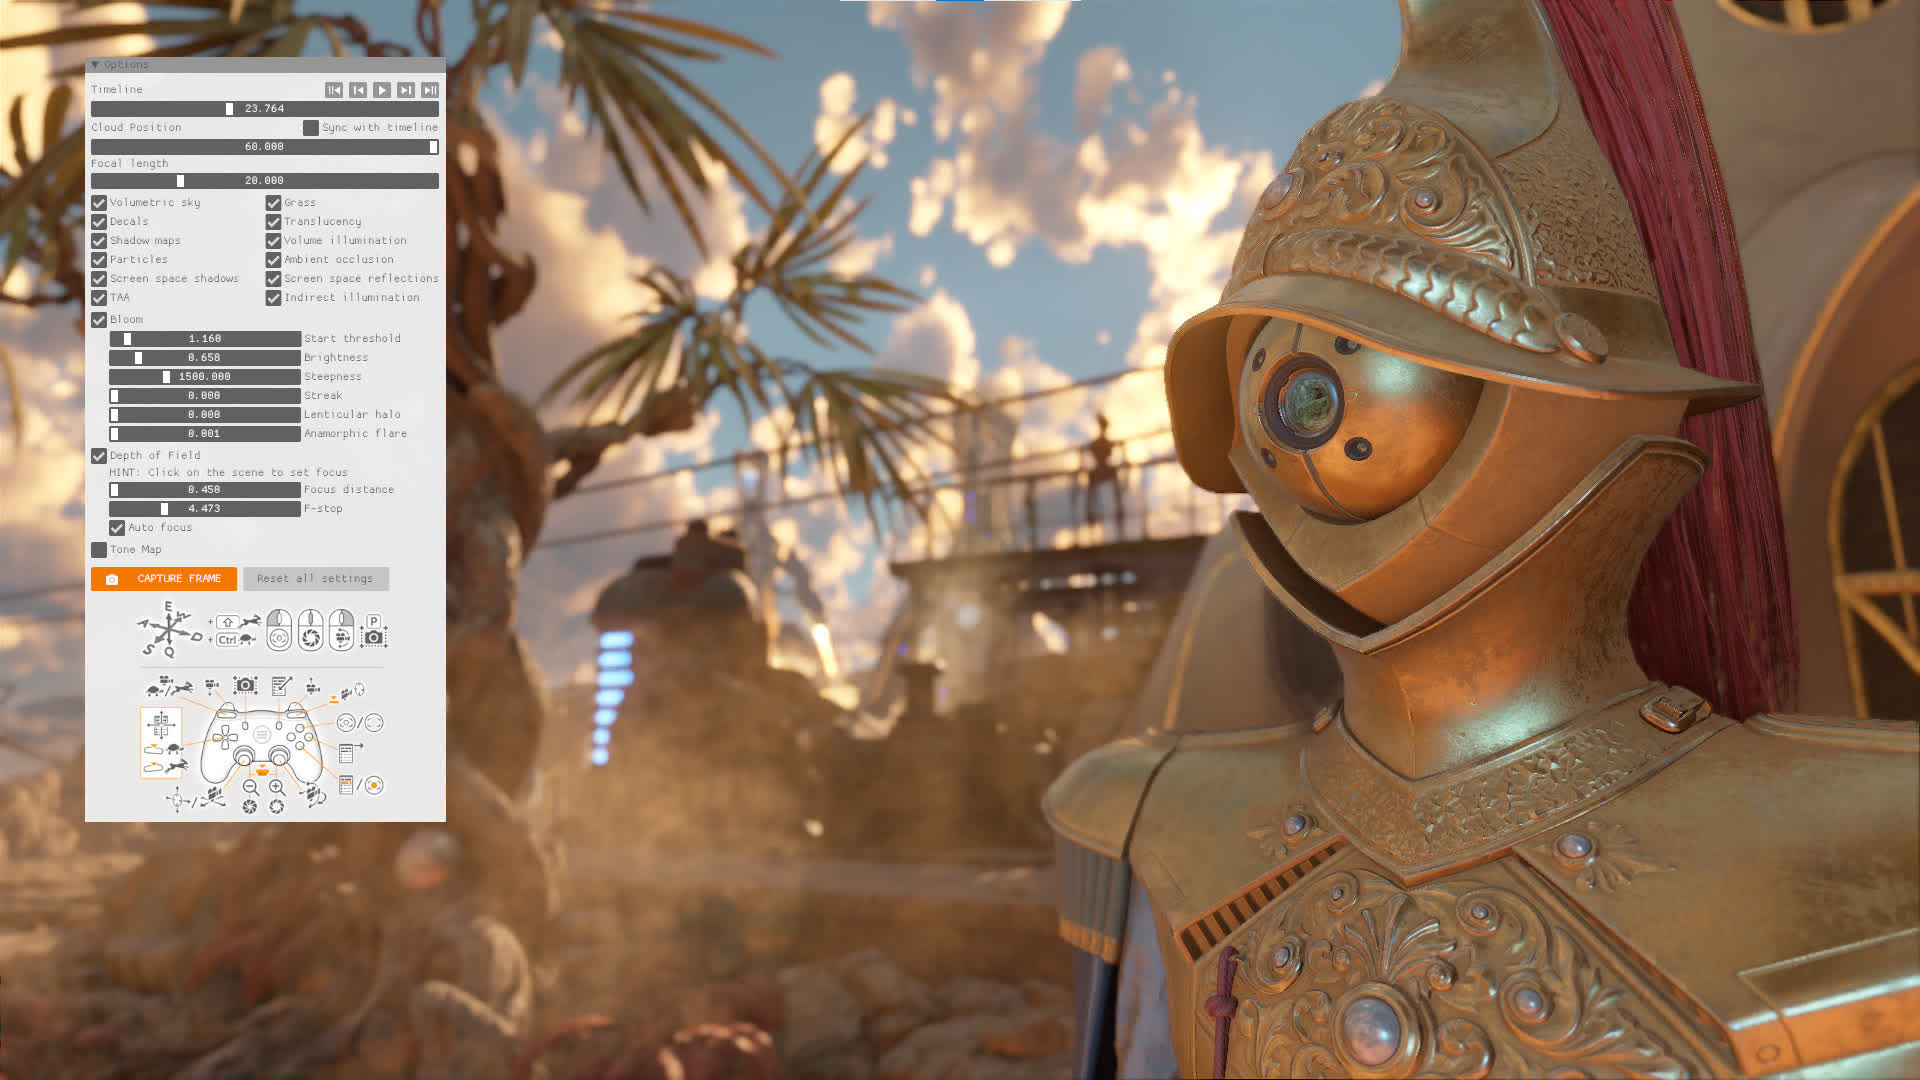
In Explorer mode, you'll be able to explore the benchmark scene and toggle or change graphics settings. Hidden in the world are several secret locations for you to find and many Easter eggs referencing the last 25 years of 3DMark Benchmarks. We recommend enabling sound for the full experience. Explorer mode for Steel Nomad and Steel Nomad Light is available for everyone who has purchased 3DMark.
Updates to 3DMark Editions
For those of you trying out 3DMark with the 3DMark Demo before you buy, the 3DMark Steel Nomad and 3DMark Steel Nomad Light benchmarks will also be available for you to run. As with all other benchmarks in the 3DMark Demo, you won't be able to access custom benchmark settings, HDR, or modes such as Explorer and VS. Mode.
With the release of Steel Nomad, we're also updating the naming of 3DMark editions to align better with their intended users. This does not affect any features in these editions.
| Old Name | New Name |
|---|---|
| 3DMark Basic Edition | 3DMark Demo |
| 3DMark Advanced Edition | 3DMark |
| 3DMark Professional Edition | 3DMark for Enterprise |
Previous Release Notes:
This update supports the launch of the 3DMark Solar Bay. Other benchmark scores are not affected.
New
- Added 3DMark Solar Bay, a cross-platform ray tracing benchmark.
Fixed
- Fixed an issue where some 3DMark tests would fail if 3DMark was installed in a directory mounted to an NTFS volume.
- We're excited to announce the launch of 3DMark Solar Bay, a new cross-platform benchmark for testing ray traced graphics performance on Windows PCs and high-end Android devices. This benchmark measures games-related graphics performance by rendering a demanding, ray-traced scene in real time.
Solar Bay is available now for Android on the Google Play Store and for Windows on Steam, Epic Games or directly from UL Solutions.
Compare ray tracing performance across platforms
Ray tracing is the showcase technology for Solar Bay, simulating real-time reflections. Compared to traditional rasterization, ray-traced scenes produce far more realistic lighting. While dedicated desktop and laptop graphics processing units (GPUs) have supported ray tracing for several years, it's only recently that integrated GPUs and Android devices have been capable of running real-time ray-traced games at frame rates acceptable to gamers.
Built using the Vulkan 1.1 API, Solar Bay offers two new tests for ray tracing- capable hardware: a quick-to-run benchmark measuring immediate performance and a stress test that measures how device performance changes over extended periods of heavy load.
Solar Bay's ray-traced workload increases over three stages, with each section increasing linearly by 100%. Solar Bay complements our heavier ray tracing benchmarks, Port Royal and Speed Way, on PC. With Solar Bay, 3DMark has a great range of ray tracing workloads, making it an excellent way to measure how your Windows or Android device's ray tracing performance scales.
Solar Bay benchmark
Run the 3DMark Solar Bay benchmark to measure a device''s ability to provide instant performance for a short period of time. This test mirrors mobile games in which the gameplay loop is a series of short bursts of activity.
Solar Bay produces four scores on completion: an overall score and three sub-scores for each ray tracing section. These scores reflect your device''s frame rate in Solar Bay; the higher the frame rate, the better the score.
Solar Bay stress test
The Solar Bay stress test is a longer test that shows how a device will perform over extended periods of ray-traced gaming. It mirrors a longer session of ray-traced gaming.
This test runs the Solar Bay workload in a loop for 20 minutes, producing a chart showing how performance varies over the test. An ideal outcome is a steady set of results showing that performance is not throttled.
Detailed results page
The 3DMark app lets you immediately compare your device's result with scores from the same model or other popular devices. With its unique charts, lists and rankings, 3DMark gives you unrivaled insights into the performance of Android devices.
New
- Added the AMD FSR feature test.
Fixed
- Fixed an issue in the Mesh Shader feature test, where a division by zero error was possible in a culling shader.
- Fixed an issue where Speed Way and the Speed Way stress test would fail if the user's Documents or Picture folders are missing.
Previous release notes
This is a minor update. Benchmark scores are not affected.
Fixed
- Fixed an issue with Night Raid colorspace when rendering on one GPU and outputting to another. This issue was purely cosmetic and had no effect on performance or results in the previous 3DMark version.
Previous release notes:
Fixed
- Fixed a rare issue that prevented 3DMark from starting on some systems.
Improved
- Autosaved result files in your Documents/3DMark/ folder now include the test name and the overall score in the filename.
Fixed
- Fixed an issue with video memory allocation in Wild Life Extreme that could cause the test to fail on some systems with an AMD APU.
- Fixed an issue that prevented Time Spy and Time Spy Extreme custom runs from looping multiple tests, for example, looping both Graphics Test 1 and Graphics Test 2 in a custom run.
Fixed
- Fixed a UI issue with the score context labels on the benchmark result screen.
- Fixed a UI issue with the CPU Profile result screen showing incorrect core and thread counts for some CPU models.
3DMark Sky Diver
3DMark Sky Diver is a DirectX 11 benchmark for PCs with integrated graphics. Released in 2014, it is now too lightweight for modern PCs. UL recommends using 3DMark Night Raid (DirectX 12) and 3DMark Wild Life (Vulkan) to benchmark laptops, notebooks and other systems with integrated graphics.
3DMark API Overhead feature test
The 3DMark API Overhead feature test was released in 2015 to coincide with the launch of Windows 10 and DirectX 12. The test compares the draw call performance of graphics APIs. At launch, this was the most significant difference between older APIs and new, low-level APIs like DirectX 12 and Vulkan. Today, developers are more likely to choose a graphics API based on feature support and compatibility. Draw call performance is no longer the deciding factor. UL has no plans to update or replace this test.
Improved
- Updated SystemInfo to v5.34 to improve compatibility with latest hardware.
Fixed
- Minor fixes for the 3DMark benchmark results screen.
Previous Release Notes:
This is a major update that adds new features to the benchmark results screen. Game performance estimates are only available in 3DMark Advanced Edition and 3DMark Professional Edition.
- This update adds a new design for the benchmark results screen to help PC gamers better understand their 3DMark scores.
- With the new features we've added, it's easy to see how your 3DMark score compares with results from other systems with the same components.

3DMark has a new result screen to help PC gamers make sense of their scores.
Learn more about your PC's performance
- 3DMark now shows you how your benchmark score compares with results from other systems with the same components. This makes it easy to see if your PC is performing correctly.

3DMark shows how your score compares with other results from the same hardware.
- This new chart shows the range of scores submitted by other 3DMark users with the same combination of CPU and GPU.
- The peaks in the chart show the most common scores. The green line shows your score. The blue, dotted line shows the average score for your combination of components.
- If your score is close to the average, it means your PC is working as it should. A score well below the average could indicate a hardware or configuration problem. The best score gives you an idea of the overclocking potential of your setup.
- The new benchmark result screen and score comparison feature are available in all 3DMark editions, including 3DMark Basic Edition.
Discover real-world game performance
- In 3DMark Advanced Edition and 3DMark Professional Edition, you can also see the frame rates you can expect in a selection of popular games.

3DMark estimates game performance from your benchmark score.
- The frame rate is an estimate based on your 3DMark score and game testing performed by UL. In this first release, you can choose from five popular games:
- Apex Legends
- Battlefield V
- Fortnite
- GTA V
- Red Dead Redemption 2
You can read more about estimating game performance from 3DMark scores on the UL Benchmarks website.